| N E W S F E E D S >>> |
Education Culture & Sport
Highland Council - Caithness
|
Revealing the
Vision of Caithness |
|
3 Current attitudes to the Arts in Caithness 4.1 Market Potential 4.1.1 It is necessary to understand the likely potential for attendance and participation from within Caithness. Socio-economic profiling of postcode sectors, drawing on census data, enables the projection of the potential numbers in the population likely to attend, on the basis of the norms of behaviour for the UK as a whole. This is powerful data, based on the Target Group Index from the British Market Research Bureau which has surveyed 25,000 people per annum with the same question since 1986; respondents and their answers are then socio-economically profiled using CACI’s ACORN on the basis of their postcode and census data. 4.1.2 For Caithness this data has been calculated based on an area encompassed by approximately 25-mile radii from both Thurso and Wick. This should define realistically a catchment area residents could be attracted from to events in Caithness, given the right package of quality programme and experience. These statistics tell us the likely propensity to attend in the population, given typical access to provision for the arts in the UK. The results are tabulated below:
* 7 = Plays, Dance, Ballet, Opera, Jazz,
Classical Music, Art Exhibitions;
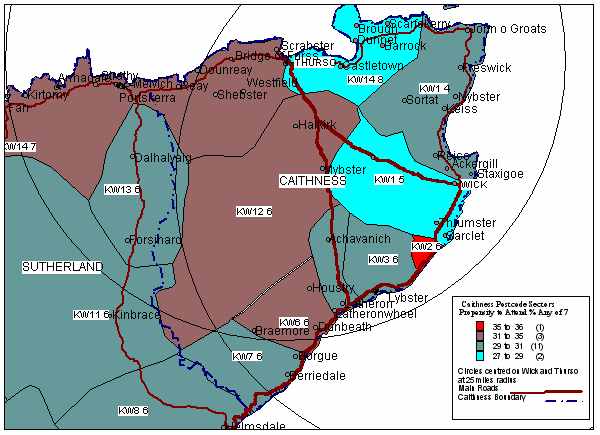
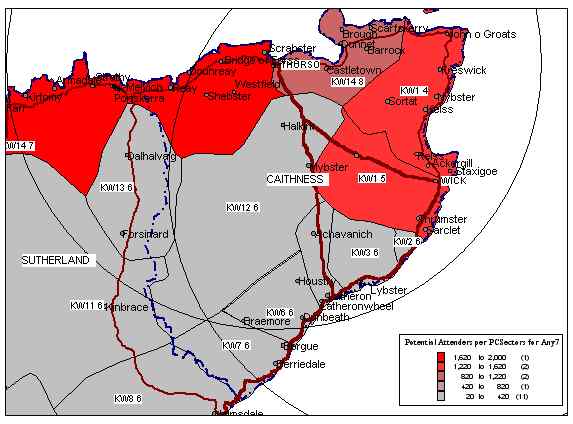
4.1.3 From the norms of behaviour we know people are likely to attend an average of between one and three times per annum according to art form. The socio-economic profile of the Caithness population shows that the residents in the projected catchment area have a propensity to attend the arts, given access to appropriate provision, rising to 36% of the population for any one of the seven main art forms. (See Map of the Percentage of Population: Potential Arts Attenders at the end of the next paragraph). 4.1.4 Taking the lowest projected average attendance per annum from Target Group Index analysis for the UK as a whole (lower than the average for Scotland) then the projected attendances appear as follows for the defined catchment area for Caithness:
Note that these are pessimistic figures, taking the least optimistic projections. From our research it is clear that current attenders in Caithness appear to attend at higher frequencies. There is also substantial evidence from venue database analysis elsewhere that in rural areas, including larger towns in rural areas, a wider and larger proportion of the public attends arts events. All this points to the potential demand for arts and entertainment provision in Caithness to be from a majority of the population. |
Map Of Potential Arts Attenders
Map of the Percentage of
Population: Potential Arts Attenders