|
Caithness.org News Bulletins |
|||
| Unemployment Data Index | Caithness.org News Index | ||
|
|
|||
|
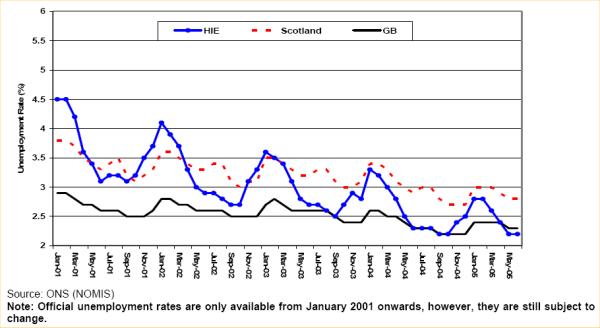
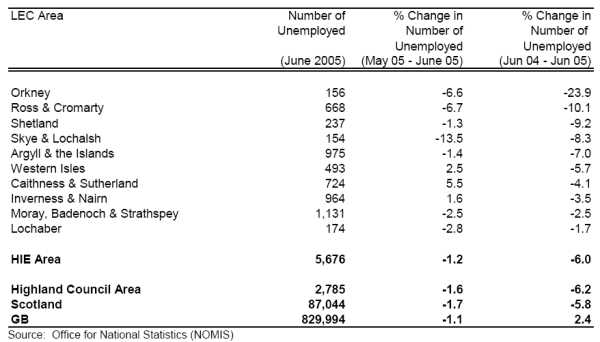
June 2005 The population of working age residents has been derived from the 2001 Census data. All of the figures in this update adopt the new methodology. On average the new proportions are around a fifth smaller than the traditional rates, but there are variations around this (comparable figures are not available for previous years). The 2001 figures have been used to calculate unemployment rates for 2002 and 2003. These rates will be amended on release of new population estimates from the GRO(s). SUMMARY As with GB & Scotland, unemployment in the HIE area fell during the month, falling 1.2% from 5,745 to 5,676 claimants. The figure is lower than the same period last year, a decrease of 6.0% (363 claimants). |
|||