|
Caithness.org News Bulletins |
|||
| Unemployment Data Index | Caithness.org News Index | ||
|
|
|||
|
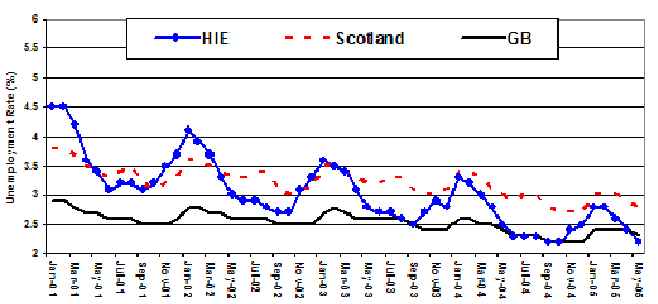
UNEMPLOYMENT DIGEST The population of working age residents has been derived from the 2001 Census data. All of the figures in this update adopt the new methodology. On average the new proportions are around a fifth smaller than the traditional rates, but there are variations around this (comparable figures are not available for previous years). The 2001 figures have been used to calculate unemployment rates for 2002 and 2003. These rates will be amended on release of new population estimates from the GRO(s). SUMMARY The number of people claiming unemployment benefit in Scotland also fell during the month, falling 2.2%, from 90,411 to 88,491 claimants. This figure is lower than the same period last year, a decrease of 6.4% (6,016 claimants). Unemployment in the HIE area also fell during the month, falling 6.3% from 6,128 to 5,745 claimants. As with Great Britain & Scotland, the figure is lower than the same period last year, a decrease of 10.9% (705 claimants).
UNEMPLOYMENT RATES
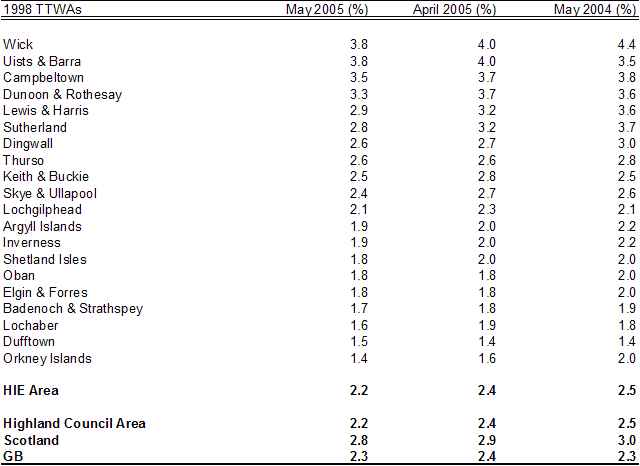
Over the month to May 2005, unemployment fell in 16 TTWA area’s, rose in 1 and was static in 3 – Thurso, Oban and Elgin & Forres. The greatest decrease of 0.4% was shared by Dunoon & Rothesay and Sutherland. Dufftown was the only area to increase over the month, rising 0.1% from 1.4% to 1.5%. Over the year to May 2005, unemployment decreased in 16 TTWAs, rose in 2 and was static in the remaining 2 – Keith & Buckie and Lochgilphead. Sutherland had the greatest decrease over the year, falling 0.9% from 3.7% to 2.8%. Uist & Barra had the greatest increase, rising 0.3% from 3.5% to 3.8%. NUMBERS OF UNEMPLOYED
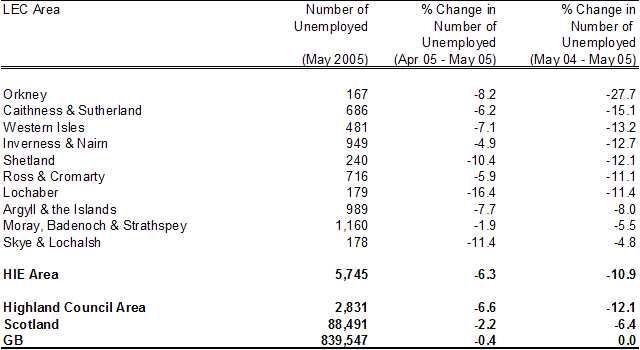
Over the month, April 2005 to May 2005, the number of people claiming unemployment fell in all 10 LEC areas. Lochaber had the greatest decrease over the month, falling 16.4% from 214 to 179 claimants. Skye & Lochalsh had the second greatest decrease, falling 11.4% from 201 to 178 claimants. Over the year May 2004 to May 2005, there was a decrease in all 10 LEC areas. Orkney had the greatest decrease over the year, falling 27.7% from 231 to 167 claimants. Caithness & Sutherland had the second greatest decrease over the year, falling 15.1% from 808 to 686 claimants. LONG-TERM UNEMPLOYMENT
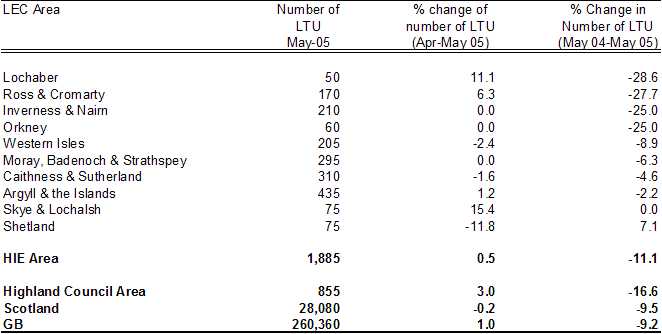
Over the month, April 2005 to May 2005, the number of long term unemployed rose in 4, fell in 3 and was static in the remaining 3 LEC Areas – Inverness & Nairn, Orkney and Moray, Badenoch & Strathspey. Skye & Lochalsh had the greatest increase over the month, rising 15.4% from 65 to 75 claimants. Shetland had the greatest decrease, falling 11.8% from 85 to 75 claimants. Over the year May 2004 to May 2005, there was a decrease in 8 of the 10 LEC areas, an increase in 1 with the remaining 1 static – Skye & Lochalsh. Lochaber had the greatest decrease over the year, falling 28.6% from 70 to 50 claimants. Shetland was the only area to increase, rising 7.1% from 70 to 75 claimants. |
|||